Friday, April 28, 2017

Fire blight outlook April 28-May 3.


NOTE: This year for fire blight risk assessment, we are comparing graphics from Maryblyt 7 and from the Cougarblight model as shown on our NEWA site. We are using the same weather data from our NEWA station to make these comparisons in both predictive programs.

CAUTION: The observations, conditions, and recommendations reported for Winchester, VA are provided as a guide to fire blight risk assessment only for the immediate area of the Virginia Tech AREC located six miles southwest of Winchester. Use of the information reported here for making orchard management decisions outside of that area is not our intent. Fruit producers outside of that area are encouraged to consult their state extension specialists for information similar to that provided here.
Maryblyt graphic April 28, 2017
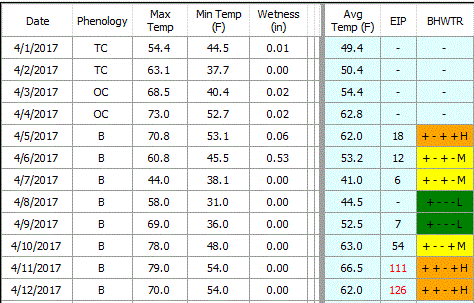
FIRE BLIGHT: Above is a cropped graphic from the Maryblyt 7 program, using Apr 5 as the date for first bloom open on Idared cultivar. Early-blooming cultivars still have scattered susceptible bloom, and later cultivars are at petal fall but with much susceptible bloom in the Winchester and central Virginia areas. Some recently planted trees still have much susceptible bloom. The temperature and rainfall data are current through Thursday evening, Apr 27. Predicted weather conditions are shown for April 28-May 3. The components of fire blight risk are indicated in the columns labeled B (blossoms open), H (degree hours for epiphytic bacterial populations), W (wetting by rain or dew), and T (average daily temperature 60 F or above). For infection to be predicted, wetting must occur after the EIP (epiphytic infection potential) reaches 100 or higher. Based on recorded temperatures and wetting, the risk column shows high risk and possible infection with any wetting Apr 11-12, 15-18, 21 and, and if bloom persists, Apr 27-May 3. Infection was indicated for Apr 12, 15-17 and 21. Predicted warming temperatures have again increase risk wherever susceptible bloom remains Apr 26-May 1. Note that risk can change quickly with warmer than predicted temperatures and wetting. In situations where all other requirements for infection have been met except wetting (as for May 1-3, wetting from any spray application (fungicide, insecticide, or thinning spray) can provide the wetting trigger for infection to occur. In high-risk situations, a protective streptomycin application is recommended ahead of predicted infection. Continue to protect late bloom and open bloom on recently planted trees as needed.

The BBS column is tracking predicted symptom development for the first infection Apr 12 and symptoms are predicted to appear Apr 27. Later infections are tracked with letters b-e, and symptoms for those are predicted to appear Apr 28-May 2. The CBS column indicates progression toward the appearance of canker margin symptoms due to extension of overwintering cankers from last year, which were predicted to Apr 22. Canker advancement cannot be prevented by chemical treatment at this time and the presence of symptoms will signal build-up of inoculum which could become a factor in the event of a trauma blight/shoot blight situation due to hail injury, etc. To offset the potential for shoot tip infection in an active fire blight year such as this one, apply the plant growth regulator, prohexadione-calcium (Apogee, Kudos), at late bloom. Shoot blight suppression results from hardening off of vegetative shoot growth starting about 10 days after the initial application. The fire blight outlook will be updated Monday, May 1.

Below is the graphic from the Cougarblight model as shown on our NEWA site. Note that we selected orchard blight history option as “Fire blight occurred in your neighborhood last year” and first blossom open date as 4/5/2017. (This date must be re-set each time this site is accessed). Cougarblight shows color-coded risk as “high” for Apr 27 and “extreme” Apr 28-May 2. 
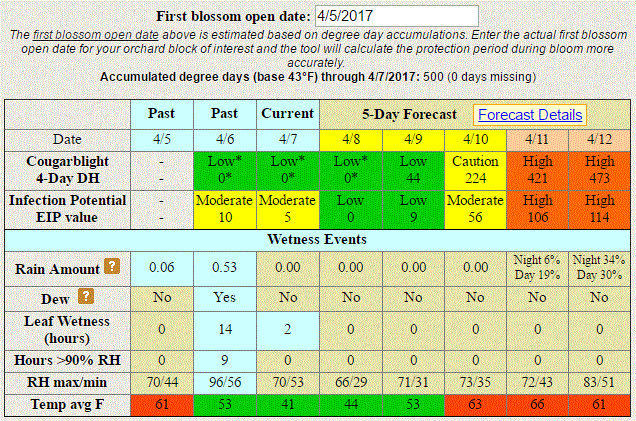
Cougarblight graphic April 28, 2017.

Wednesday, April 26, 2017

Heavy scab and rust infection period and fire blight outlook Apr 26-May 1.


NOTE: This year for fire blight risk assessment, we are comparing graphics from Maryblyt 7 and from the Cougarblight model as shown on our NEWA site. We are using the same weather data from our NEWA station to make these comparisons in both predictive programs.

CAUTION: The observations, conditions, and recommendations reported for Winchester, VA are provided as a guide to fire blight risk assessment only for the immediate area of the Virginia Tech AREC located six miles southwest of Winchester. Use of the information reported here for making orchard management decisions outside of that area is not our intent. Fruit producers outside of that area are encouraged to consult their state extension specialists for information similar to that provided here.

SCAB and RUSTS:  We have just seen extended wetting of more than 46 hours. Because apple scab lesions resulting from infection periods during the period March 26 to Apr 7 may have been present, consider this to be a heavy secondary infection period. Also, because of the high susceptibility of developing fruits to quince rust, it is suggested that fungicides with strong after-infection activity against rusts and scab be included in the next fungicide application.
Maryblyt graphic for Winchester, Apr 26, 2017. Click to enlarge.
FIRE BLIGHT: Above is a cropped graphic from the Maryblyt 7 program, using Apr 5 as the date for first bloom open on Idared cultivar. Early-blooming cultivars still have scattered susceptible bloom, and later cultivars are at petal fall but with much susceptible bloom in the Winchester and central Virginia areas. Some recently planted trees still have much susceptible bloom. The temperature and rainfall data are current through Tuesday evening, Apr 25. Predicted weather conditions are shown for April 26-May 1. The components of fire blight risk are indicated in the columns labeled B (blossoms open), H (degree hours for epiphytic bacterial populations), W (wetting by rain or dew), and T (average daily temperature 60 F or above). For infection to be predicted, wetting must occur after the EIP (epiphytic infection potential) reaches 100 or higher. Based on recorded temperatures and wetting, the risk column shows high risk and possible infection with any wetting Apr 11-12, 15-18, and 21, and if bloom persists, Apr 27-May 1. Infection was indicated for Apr 12, 15-17 and 21. Predicted warming temperatures will again increase risk wherever susceptible bloom remains Apr 26-May 1. Note that risk can change quickly with warmer than predicted temperatures and wetting. In situations where all other requirements for infection have been met except wetting (as for Apr 27-May 1), wetting from any spray application (fungicide, insecticide, or thinning spray) can provide the wetting trigger for infection to occur. In high-risk situations, a protective streptomycin application is recommended ahead of predicted infection. Continue to protect late bloom and open bloom on recently planted trees as needed.

The BBS column is tracking predicted symptom development for the first infection Apr 12 and symptoms are predicted to appear Apr 27. Later infections are tracked with letters b-d, and symptoms for those are predicted to appear Apr 28-30. The CBS column indicates progression toward the appearance of canker margin symptoms due to extension of overwintering cankers from last year, which would be predicted to occur after that value reached 100 Apr 22. Canker advancement cannot be prevented by chemical treatment at this time and the presence of symptoms will signal build-up of inoculum which could become a factor in the event of a trauma blight/shoot blight situation due to hail injury, etc. To offset the potential for shoot tip infection in an active fire blight year such as this one, apply the plant growth regulator, prohexadione-calcium (Apogee, Kudos), at late bloom. Shoot blight suppression results from hardening off of vegetative shoot growth starting about 10 days after the initial application. The fire blight outlook will be updated Friday, Apr 28.

Below is the graphic from the Cougarblight model as shown on our NEWA site. Note that we selected orchard blight history option as “Fire blight occurred in your neighborhood last year” and first blossom open date as 4/5/2017. (This date must be re-set each time this site is accessed). Cougarblight shows color-coded risk as “high” for Apr 27 and “extreme” for Apr 28-30. 
Cougarblight graphic for Winchester, Apr 26, 2017. Click to enlarge.

Monday, April 24, 2017

Fire blight and scab outlook April 24-28.


NOTE: This year for fire blight risk assessment, we are comparing graphics from Maryblyt 7 and from the Cougarblight model as shown on our NEWA site. We are using the same weather data from our NEWA station to make these comparisons in both predictive programs.

CAUTION: The observations, conditions, and recommendations reported for Winchester, VA are provided as a guide to fire blight risk assessment only for the immediate area of the Virginia Tech AREC located six miles southwest of Winchester. Use of the information reported here for making orchard management decisions outside of that area is not our intent. Fruit producers outside of that area are encouraged to consult their state extension specialists for information similar to that provided here.

APPLE SCAB lesions resulting from infection periods during the period March 26 to Apr 7 may be present in poorly protected orchards, and extended wetting could result in heavy secondary infection this week, Apr 24-26.

Maryblyt graphic for Winchester, Apr 24, 2017. Click to enlarge.
FIRE BLIGHT: Above is a cropped graphic from the Maryblyt 7 program, using Apr 5 as the date for first bloom open on Idared cultivar. Many trees still have some susceptible bloom in the Winchester area. The temperature and rainfall data are current through Sunday evening, Apr 23. Predicted weather conditions are shown for April 24-28. The components of fire blight risk are indicated in the columns labeled B (blossoms open), H (degree hours for epiphytic bacterial populations), W (wetting by rain or dew), and T (average daily temperature 60 F or above). For infection to be predicted, wetting must occur after the EIP (epiphytic infection potential) reaches 100 or higher. Based on recorded temperatures and wetting, the risk column shows high risk and possible infection with any wetting Apr 11-12, 15-18, and 21, and if bloom persists, Apr 27-28. Infection was indicated for Apr 12, and 15-17 and is predicted with wetting Apr 21. Note that risk can change quickly with unpredicted warmer temperatures and wetting. In high-risk situations, a protective streptomycin application is recommended ahead of predicted infection. Predicted cooler temperatures should reduce risk Apr 24-25, but will probably cause late bloom to persist, setting up higher risk of infection of late bloom with warmer temperatures Apr 27-28. Continue to protect late bloom and open bloom on young trees as needed.

The BBS column is tracking predicted symptom development for the first infection Apr 12 and symptoms are predicted to appear Apr 27. The CBS column indicates progression toward the appearance of canker margin symptoms due to extension of overwintering cankers from last year, which would be predicted to occur after that value reached 100 Apr 22. Canker advancement cannot be prevented by chemical treatment at this time and the presence of symptoms will signal build-up of inoculum which could become a factor in the event of a trauma blight/shoot blight situation due to hail injury, etc. To offset the potential for shoot tip infection in an active fire blight year such as this one, apply the plant growth regulator, prohexadione-calcium (Apogee, Kudos), at late bloom. Shoot blight suppression results from hardening off of vegetative shoot growth starting about 10 days after the initial application. The fire blight outlook will be updated Wednesday, Apr 26.

Below is the graphic from the Cougarblight model as shown on our NEWA site. Note that we selected orchard blight history option as “Fire blight occurred in your neighborhood last year” and first blossom open date as 4/5/2017. (This date must be re-set each time this site is accessed). Cougarblight shows color-coded risk as “extreme” Apr 21, and “high” Apr 22-23 then declining Apr 24-26, but returning to high and extreme Apr 27-28. 

Cougarblight graphic for Winchester, Apr 24, 2017. Click to enlarge.

Friday, April 21, 2017

Fire blight risk outlook for Winchester April 21-26.


NOTE: This year for fire blight risk assessment, we are comparing graphics from Maryblyt 7 and from the Cougarblight model as shown on our NEWA site. We are using the same weather data from our NEWA station to make these comparisons in both predictive programs.

CAUTION: The observations, conditions, and recommendations reported for Winchester, VA are provided as a guide to fire blight risk assessment only for the immediate area of the Virginia Tech AREC located six miles southwest of Winchester. Use of the information reported here for making orchard management decisions outside of that area is not our intent. Fruit producers outside of that area are encouraged to consult their state extension specialists for information similar to that provided here.
Maryblyt graphic for Winchester, Apr 21, 2017. Click to enlarge.
FIRE BLIGHT: Above is a cropped graphic from the Maryblyt 7 program, using Apr 5 as the date for first bloom open on Idared cultivar. Early-blooming cultivars still have some susceptible bloom, and later cultivars are near full bloom in the Winchester area. The temperature and rainfall data are current through Thursday evening, April 20. Predicted weather conditions are shown for April 21-26. The components of fire blight risk are indicated in the columns labeled B (blossoms open), H (degree hours for epiphytic bacterial populations), W (wetting by rain or dew), and T (average daily temperature 60 F or above). For infection to be predicted, wetting must occur after the EIP (epiphytic infection potential) reaches 100 or higher. Based on recorded temperatures and wetting, the risk column shows high risk and possible infection with any wetting Apr 11-12, 15-18 21, 24-25 and with slightly warmer than indicated temperatures and wetting Apr 13-14 and 18-20. Infection was indicated for Apr 12, and 15-17 and is predicted with wetting Apr 21. Note that risk can change quickly with unpredicted warmer temperatures and wetting. In high-risk situations, a protective streptomycin application is recommended ahead of predicted infection. Predicted cooler temperatures should reduce risk Apr 22-24, but will probably cause late bloom to persist into next week, and predicted warmer temperatures Apr 26-30 (not shown) will probably again bring high risk to late bloom. Continue to protect late bloom and bloom on newly-planted trees as needed.

The BBS column is tracking predicted symptom development for the first infection Apr 12 and symptoms are predicted to appear Apr 26. (Symptoms from artificial inoculation Apr 9 already appeared at our AREC by Apr 18). The CBS column indicates progression toward the appearance of canker margin symptoms due to extension of overwintering cankers from last year, which would be predicted to occur when that value reaches 100 Apr 23. Canker advancement cannot be prevented by chemical treatment at this time and the presence of symptoms will signal build-up of inoculum which could become a factor in the event of a trauma blight/shoot blight situation due to hail injury, etc. To offset the potential risk of shoot tip infection in an active fire blight year such as this one, apply the plant growth regulator, prohexadione-calcium (Apogee, Kudos), at late bloom. Shoot blight suppression results from hardening off of vegetative shoot growth starting about 10 days after the initial application. The fire blight outlook will be updated Monday, Apr 24.

Below is the graphic from the Cougarblight model as shown on our NEWA site. Note that we selected orchard blight history option as “Fire blight occurred in your neighborhood last year” and first blossom open date as 4/5/2017. (This date must be re-set each time this site is accessed). Cougarblight shows color-coded risk assessment as “Cougarblight 4-Day DH” which was “extreme” Apr 17-19, and for today, Apr 21, and remains “high” Apr 22-23. 
Cougarblight graphic for Winchester, Apr 21, 2017. Click to enlarge.
Early blossom symptoms (center) Apr 18 from artificial inoculation Apr 9.

Wednesday, April 19, 2017

Fire blight outlook April 19.


NOTE: This year for fire blight risk assessment, we are comparing graphics from Maryblyt 7 as in previous years, and also from the Cougarblight model as shown on our NEWA site. We are using the same weather data from our NEWA station to make these comparisons.

CAUTION: The observations, conditions, and recommendations reported for Winchester, VA are provided as a guide to fire blight risk assessment only for the immediate area of the Virginia Tech AREC located six miles southwest of Winchester. Use of the information reported here for making orchard management decisions outside of that area is not our intent. Fruit producers outside of that area are encouraged to consult their state extension specialists for information similar to that provided here.
 
Maryblyt graphic for Winchester, Apr 19, 2017. Click to enlarge.
 FIRE BLIGHT: Above is a cropped graphic from the Maryblyt 7 program, using Apr 5 as the date for first bloom open on Idared cultivar. Early-blooming cultivars still have much susceptible bloom, and later cultivars such as Rome Beauty are near full bloom in the Winchester area. The temperature and rainfall data are current through Tuesday evening, April 18. Predicted weather conditions are shown for April 19-24. The components of fire blight risk are indicated in the columns labeled B (blossoms open), H (degree hours for epiphytic bacterial populations), W (wetting by rain or dew), and T (average daily temperature 60 F or above). For infection to be predicted, wetting must occur after the EIP (epiphytic infection potential) reaches 100 or higher. Based on recorded temperatures and wetting, the risk column shows high risk and possible infection with any wetting Apr 11-12, 15-18 and 21, and with slightly warmer than predicted temperatures and wetting Apr 13-14 and 20. Infection was indicated for Apr 12, and 15-18 and is predicted with wetting Apr 21. Note that risk can change quickly with unpredicted warmer temperatures and wetting. In high-risk situations, a protective streptomycin application is recommended ahead of predicted infection.

Predicted cooler temperatures should reduce risk Apr 19-20 and 22-24, but will probably cause late bloom to persist into next week. Continue to protect late bloom as needed. The fire blight outlook will be updated Friday, Apr 21.

Below is the graphic from the Cougarblight model as shown on our NEWA site. Note that we selected orchard blight history option as “Fire blight occurred in your neighborhood last year” and first blossom open date as 4/5/2017. (This date must be re-set each time this site is accessed). Cougarblight shows color-coded risk assessment as “Cougarblight 4-Day DH” which is “extreme” Apr 17-18, and “high” Apr 19-23. Both predictive programs indicate a reduction in fire blight risk after Apr 18, but EIP values are somewhat higher in Maryblyt than for Cougarblight.

Cougarblight graphic for Winchester, Apr 19, 2017. Click to enlarge.

Monday, April 17, 2017

Continued risk of fire blight infection April 17!


NOTE: This year for fire blight risk assessment, we are comparing graphics from Maryblyt 7 as in previous years, and also from the Cougarblight model as shown on our NEWA site. We are using the same weather data from our NEWA station to make these comparisons.

CAUTION: The observations, conditions, and recommendations reported for Winchester, VA are provided as a guide to fire blight risk assessment only for the immediate area of the Virginia Tech AREC located six miles southwest of Winchester. Use of the information reported here for making orchard management decisions outside of that area is not our intent. Fruit producers outside of that area are encouraged to consult their state extension specialists for information similar to that provided here.
Maryblyt graphic for Winchester, Apr 17, 2017. Click to enlarge.
 FIRE BLIGHT: Above is a cropped graphic from the Maryblyt 7 program, using Apr 5 as the date for first bloom open on Idared cultivar. Most cultivars now have some susceptible bloom open in the Winchester area. The temperature and rainfall data are current through Sunday evening, April 16. Predicted weather conditions are shown for April 17-22. The components of fire blight risk are indicated in the columns labeled B (blossoms open), H (degree hours for epiphytic bacterial populations), W (wetting by rain or dew), and T (average daily temperature 60 F or above). For infection to be predicted, wetting must occur after the EIP (epiphytic infection potential) reaches 100 or higher. Based on recorded temperatures and wetting, the risk column shows high risk and possible infection with any wetting Apr 11-12 and 15-18, and with slightly warmer than predicted temperatures and wetting Apr 13-14 and 19-20. Infection was indicated for Apr 12, and 15-16 and is predicted with wetting Apr 17. Be aware that in situations where all other requirements for infection have been met except wetting, wetting from any spray application can provide the wetting trigger for infection to occur, and including streptomycin is suggested in such situations. In high-risk situations, a protective streptomycin application is recommended ahead of predicted infection.

As indicated with the changes in prediction for Apr 15-17 since the Apr 14 posting last week, risk can change quickly with unpredicted warmer temperatures and wetting. Particularly this week, continue to protect late bloom as needed. The fire blight outlook will be updated Wednesday, Apr 19. 
Below is the graphic from the Cougarblight model as shown on our NEWA site. Note that we selected orchard blight history option as “Fire blight occurred in your neighborhood last year” and first blossom open date as 4/5/2017. (This date must be re-set each time this site is accessed). Cougarblight shows color-coded risk assessment as “Cougarblight 4-Day DH” which is “extreme” Apr 16-18, and “high” Apr 19-20. Both predictive programs indicate a reduction in fire blight risk after Apr 18, but EIP values are somewhat higher in Maryblyt than for Cougarblight and that might be a factor for predicted risk later this week if weather conditions are more favorable for fire blight than currently predicted for Apr 19-22.
Cougarblight graphic for Winchester, Apr 17, 2017. Click to enlarge.

Saturday, April 15, 2017

Summary of early season fungal disease activity on apple and peach at Winchester.


Apple scab ascospores were first trapped Mar 10. Scab infection periods occurred on Mar 26-27: wet 15 hr at 46-60°, 0.23 in. rain. (also rust infection); Mar 27-28: wet 23 hr at 53-62°, 0.36 in. rain. (also rust infection); Mar 31-Apr 1: wet 23 hr at 41-48° with 0.95 in rain; Apr 3-4: wet 15 hr at 52-63° with 0.03 in rain. (also rust infection); Apr 6-7: wet 14 hr at 50-55° with 0.53 in rain. (also rust infection).
Apple scab pressure has been significant, with five infection periods in the past three weeks. Lesions from the March infection periods will be expected to appear in the next week and conidia will then be produced for heavy secondary infection. These five infection periods from Mar 26 to Apr 7 came with enough total rainfall to challenge weathering capabilities of protective fungicides.
Cedar-apple rust and quince rust have been active for about two weeks. Pink to petal fall is the peak time for susceptibility to quince rust. We suggest EBDC fungicides as routine protectants for rusts and scab, but always include an SI fungicide (Rally, Rhyme, Inspire Super, Indar) for after-infection rust control if there is any doubt about lack of protective residue.
Apple powdery mildew conidia were available Mar 27. The image of mildew below illustrates heavy sporulation of a primary infection source of inoculum. Any mild “dry weather “ day above 53° is suitable for mildew infection. From Mar 27 to Apr 14 we have had at least nine mildew infection days.
Primary powdery mildew infection on Ginger Gold apple.
Note heavy sporulation on Apr 14, 2017.
Early peach leaf curl symptoms were observed at our AREC Apr 14 (below). This infection occurs with extended wetting soon after bud swell. In our test plots, a protective fungicide applied Feb 28 gave excellent control, but the same fungicide applied Mar 9 was less effective.
Leaf curl symptoms on Redhaven peach Apr 14, 2017.
Peach scab overwinters in lesions on peach shoots (below). Lesions are now producing spores, and it is important to maintain a protective fungicide residue to prevent infection during extended wetting periods over the next 4-6 weeks. Infection can require as much as 7 weeks to appear on fruit.
Peach scab lesion on a Redhaven twig Apr 14,2017.
Close proximity to the young fruit makes it a challenge to protect against infection.

Friday, April 14, 2017

Fire blight risk outlook, April 14-20.

NOTE: This year for fire blight risk assessment, we are comparing graphics from Maryblyt 7 as in previous years, and also from the Cougarblight model as shown on our NEWA site. We are using the same weather data from our NEWA station to make these comparisons.

CAUTION: The observations, conditions, and recommendations reported for Winchester, VA are provided as a guide to fire blight risk assessment only for the immediate area of the Virginia Tech AREC located six miles southwest of Winchester. Use of the information reported here for making orchard management decisions outside of that area is not our intent. Fruit producers outside of that area are encouraged to consult their state extension specialists for information similar to that provided here.
Maryblyt graphic for Winchester, Apr 14, 2017. Click to enlarge.
FIRE BLIGHT: Above is a cropped graphic from the Maryblyt 7 program, using Apr 5 as the date of first bloom open on Idared cultivar. Early cultivars are near full bloom and most cultivars have some bloom open. The temperature and rainfall data are current through Thursday evening, April 13. Predicted weather conditions are shown for April 14-20. The components of fire blight risk are indicated in the columns labeled B (blossoms open), H (degree hours for epiphytic bacterial populations), W (wetting by rain or dew), and T (average daily temperature 60 F or above). For infection to be predicted, wetting must occur after the EIP (epiphytic infection potential) reaches 100 or higher. Based on recorded temperatures and wetting, the risk column shows high risk and possible infection and possible infection with any wetting Apr 11-12, and with slightly warmer than predicted temperatures and wetting Apr 13-14 and 17-19. Infection is predicted with wetting Apr 16. Be aware that in situations where all other requirements for infection have been met except wetting, wetting from any spray application can provide the wetting trigger for infection to occur, and including streptomycin is suggested in such situations. In high-risk situations, a protective streptomycin application is recommended ahead of predicted infection.

Be aware that risk can change quickly with unpredicted warmer temperatures and wetting. The fire blight outlook will be updated Monday, Apr 17.

Below is the graphic from the Cougarblight model as shown on our NEWA site. Note that we selected orchard blight history option as “Fire blight occurred in your neighborhood last year” and first blossom open date as 4/5/2017. This date must be re-set each time this site is accessed. Cougarblight shows color-coded risk assessment as “Cougarblight 4-Day DH” which remains “extreme” through Apr 12-14, and “high” Apr 15-19. (EIP in Cougarblight lacks only one unit for Apr 16, which would move the risk to “extreme” for Apr 16). Comparable EIP values and trends are shown for both predictive programs each day this week. 
Cougarblight graphic for Winchester, Apr 14, 2017. Click to enlarge.

Wednesday, April 12, 2017

Fire blight risk for April 12-13.


NOTE: This year for fire blight risk assessment, we are comparing graphics from Maryblyt 7 as in previous years, and also from the Cougarblight model as shown on our NEWA site. We are using the same weather data from our NEWA station to make these comparisons.

CAUTION: The observations, conditions, and recommendations reported for Winchester, VA are provided as a guide to fire blight risk assessment only for the immediate area of the Virginia Tech AREC located six miles southwest of Winchester. Use of the information reported here for making orchard management decisions outside of that area is not our intent. Fruit producers outside of that area are encouraged to consult their state extension specialists for information similar to that provided here.
 
Maryblyt graphic for Winchester, Apr 12, 2017. Click to enlarge.
FIRE BLIGHT: Above is a cropped graphic from the Maryblyt 7 program, using Apr 5 as the date of first bloom open on Idared cultivar. Early cultivars are near full bloom and most cultivars have some bloom open. The temperature and rainfall data are current through Tuesday evening, April 11. Predicted weather conditions are shown for April 12-17. The components of fire blight risk are indicated in the columns labeled B (blossoms open), H (degree hours for epiphytic bacterial populations), W (wetting by rain or dew), and T (average daily temperature 60 F or above). For infection to be predicted, wetting must occur after the EIP (epiphytic infection potential) reaches 100 or higher. Based on recorded temperatures and forecasted temperatures and wetting, the risk column shows high risk and possible infection and possible infection with any wetting Apr 11-12, and with slightly warmer than predicted temperatures and wetting Apr 13-14. Based on cooler predicted temperatures later in the week, risk will subside Apr 14-15, but will again increase with warmer temperatures Apr 16-17. Be aware that in situations where all other requirements for infection have been met except wetting, wetting from any spray application can provide the wetting trigger for infection to occur, and including streptomycin is suggested in such situations. In high-risk situations, a protective streptomycin application is recommended ahead of predicted infection.

Be aware that risk can change quickly with unpredicted warmer temperatures and wetting. The fire blight outlook will be updated Friday, Apr 14.

Below is the graphic from the Cougarblight model as shown on our NEWA site. Note that we selected orchard blight history option as “Fire blight occurred in your neighborhood last year” and first blossom open date as 4/5/2017. This date must be re-set each time this site is accessed. Cougarblight shows color-coded risk assessment as “Cougarblight 4-Day DH” which remains extreme through Apr 11-13, then subsides to high Apr 14 and low Apr 15, but returns to high Apr 16. Comparable EIP values and trends are shown for both predictive programs each day this week. 

Cougarblight graphic for Winchester, Apr 12, 2017. Click to enlarge.

Monday, April 10, 2017

High fire blight risk April 11-13!


NOTE: This year for fire blight risk assessment, we are comparing and posting graphics from Maryblyt 7 as in previous years, and also from the Cougarblight model as shown on our NEWA site. We are using the same weather data from our NEWA station to make these comparisons.

CAUTION: The observations, conditions, and recommendations reported for Winchester, VA are provided as a guide to fire blight risk assessment only for the immediate area of the Virginia Tech AREC located six miles southwest of Winchester. Use of the information reported here for making orchard management decisions outside of that area is not our intent. Fruit producers outside of that area are encouraged to consult their state extension specialists for information similar to that provided here.
 
(Click to enlarge graphic)
FIRE BLIGHT: Above is a cropped graphic from the Maryblyt 7 program, using Apr 5 as the date of first bloom open on Idared cultivar. Early cultivars are approaching full bloom and later ones are at open cluster or pink and will come into bloom in the next two days. The temperature and rainfall data are current through Monday morning, April 10. Predicted weather conditions are shown for April 10-15. The components of fire blight risk are indicated in the columns labeled B (blossoms open), H (degree hours for epiphytic bacterial populations), W (wetting by rain or dew), and T (average daily temperature 60 F or above). For infection to be predicted, wetting must occur after the EIP (epiphytic infection potential) reaches 100 or higher. Based on recorded temperatures and forecasted temperatures and wetting, the risk column shows high risk for Apr 11-13, and possible infection with any wetting Apr 11-12, and with slightly warmer than predicted temperatures Apr 13. Based on cooler predicted temperatures later in the week, risk will subside Apr 14-15, but will again increase with warmer temperatures Apr 16. Be aware that in situations where all other requirements for infection have been met except wetting, wetting from a maintenance spray application can provide the wetting trigger for infection to occur and routinely including streptomycin is suggested in such situations. In high-risk situations, a protective streptomycin application is recommended ahead of predicted infection.

Be aware that risk can change quickly with unpredicted warmer temperatures and wetting. The fire blight outlook will be updated Apr 12.

Below is the graphic from the Cougarblight model as shown on our NEWA site. Note that we selected orchard blight history option as “Fire blight occurred in your neighborhood last year” and first blossom open date as 4/5/2017. This date must be re-set each time this site is accessed. Cougarblight shows color-coded risk assessment as “Cougarblight 4-Day DH” which is "extreme" through Apr 11-13, then subsides to low Apr 15. Comparable EIP values and trends are shown for both predictive programs each day this week. 
(Click to enlarge graphic)

Friday, April 7, 2017

Scab and rust infection period Apr 6-7; fire blight outlook for Apr 8-12.

SCAB and RUSTS: At our AREC in Winchester, we recorded our fourth apple scab infection period in ten days April 6-7: 14 hr wet at 50 to 55° with 0.53 inches of rain. This was also a possible rust infection period. Red Delicious, Gala, and Idared fruit buds were at pink to early bloom, but Golden Delicious and Rome Beauty were mostly at open cluster

FIRE BLIGHT OUTLOOK: This year for fire blight risk assessment, we will be comparing and posting graphics from Maryblyt 7, as in previous years, and also from the Cougarblight model as shown on our NEWA site. We will be using the same weather data from our NEWA station to make these comparisons.

CAUTION: The observations, conditions, and recommendations reported for Winchester, VA are provided as a guide to fire blight risk assessment only for the immediate area of the Virginia Tech AREC located six miles southwest of Winchester. Use of the information reported here for making orchard management decisions outside of that area is not our intent. Fruit producers outside of that area are encouraged to consult their state extension specialists for information similar to that provided here.
(Click to enlarge graphic)
FIRE BLIGHT: Above is a cropped graphic from the Maryblyt 7 program. We are using Apr 5 as the date of first bloom open on Idared cultivar. The temperature and rainfall data are current through Friday evening, April 7. Predicted weather conditions are shown for April 8-12. The components of fire blight risk are indicated in the columns labeled B (blossoms open), H (degree hours for epiphytic bacterial populations), W (wetting by rain or dew), and T (average daily temperature 60 F or above). For infection to be predicted, wetting must occur after the EIP (epiphytic infection potential) reaches 100 or higher. Based on recorded temperatures and wetting, the risk column showed high risk for Apr 5, but EIP was only 18, not yet at the 100 level required for infection. With cooler predicted temperatures through Apr 9, fire blight risk should remain low. However, with warmer predicted temperatures Apr 10-12, the EIP would reach 111 and 126 for Apr 11 and 12, respectively. Based on predicted temperatures, the risk column shows high risk for Apr 11-12, with only wetting lacking as the trigger for fire blight infection these days. Be aware that in situations where all other requirements for infection have been met except wetting, wetting from a maintenance spray application can provide the wetting trigger for infection to occur. In high-risk situations, a protective streptomycin application is recommended ahead of predicted infection.

Below is the graphic from the Cougarblight model as shown on our NEWA site. Note that we selected orchard blight history option as “Fire blight occurred in your neighborhood last year” and first blossom open date as 4/5/2017. This date must be re-set each time this site is accessed. Cougarblight shows color-coded risk assessment as “Cougarblight 4-Day DH” which remains low through Apr 9, then increases to "Caution" Apr 10, and "High" by Apr 11 and 12 when the EIP reaches 106-114, comparable to the values of 111-126 shown for these dates in Maryblyt. 
(Click to enlarge graphic)
Be aware that risk can change quickly with unpredicted warmer temperatures and wetting. The fire blight outlook will be updated Monday, Apr 10.

Thursday, April 6, 2017

Fire blight outlook for April 6: Maryblyt vs. Cougarblight comparison.


NOTE: This year for fire blight risk assessment, we will be comparing and posting graphics from Maryblyt 7 as in previous years, and also from the Cougarblight model as shown on our NEWA site. We will be using the same weather data from our NEWA station to make these comparisons.

CAUTION: The observations, conditions, and recommendations reported for Winchester, VA are provided as a guide to fire blight risk assessment only for the immediate area of the Virginia Tech AREC located six miles southwest of Winchester. Use of the information reported here for making orchard management decisions outside of that area is not our intent. Fruit producers outside of that area are encouraged to consult their state extension specialists for information similar to that provided here.

(Click to enlarge the graphic).

FIRE BLIGHT: Above is a cropped graphic from the Maryblyt 7 program. We will use Wednesday, Apr 5 as the date of first bloom open on Idared cultivar. The temperature and rainfall data are current through Wednesday evening, April 5. Predicted weather conditions are shown for April 6-11. The components of fire blight risk are indicated in the columns labeled B (blossoms open), H (degree hours for epiphytic bacterial populations), W (wetting by rain or dew), and T (average daily temperature 60 F or above). For infection to be predicted, wetting must occur after the EIP (epiphytic infection potential) reaches 100 or higher.  Based on recorded temperatures and wetting, the risk column shows high risk for Apr 5, but EIP was only 18, and had not yet reached the 100 level required for infection. There were occasional blossoms open at our AREC as early as Apr 3 or 4, but with the indicated temperatures, that would have made little difference in the risk interpretation for Apr 6. With cooler predicted temperatures through Apr 9, fire blight risk should remain low to moderate. However, with warmer predicted temperatures Apr 10-11, the EIP would reach 78 by Apr 11.

Be aware that risk can change quickly with unpredicted warmer temperatures and wetting. In high-risk situations, a protective streptomycin application is recommended ahead of predicted infection. The fire blight outlook will be updated Friday, Apr 7.

Below is the graphic from the Cougarblight model as shown on our NEWA site. Note that we selected orchard blight history option as “Fire blight occurred in your neighborhood last year” and first blossom open date as 4/5/2017. This date must be re-set each time the site is accessed. Cougarblight shows color-coded risk assessment as “Cougarblight 4-Day DH” which remains low through Apr 9, then increases to high by Apr 11 when the EIP reaches 77, comparable to the value of 78 shown for Maryblyt. 

(Click to enlarge the graphic).
For further discussion about fire blight risk assessment using Cougarblight, see the notes under "Disease management" under the graphic on the web site. 

Tuesday, April 4, 2017

Apple scab infection April 3-4

At our AREC in Winchester, we recorded our third apple scab infection period in eight days April 3-4: 15 hr wet at 52 to 63° with 0.03 inches of rain. This was also a possible rust infection period. Red Delicious, Gala, and Idared fruit buds are now at open cluster stage, but Golden Delicious and Rome Beauty are still at tight cluster

Monday, April 3, 2017

Apple scab infection March 31-April 1.

An apple scab infection period was recorded at our AREC Mar 31-Apr 1: 23 hr wet at 41 to 48° with 0.95 inches of rain. Cedar-apple rust spores were released with wetting earlier last week. During the most recent rain, quince rust spores also matured. Fruit buds now at tight cluster to open cluster stage are susceptible to quince rust. Sunday, Apr 3 was favorable for apple powdery mildew infection.